

Early startup analytics can make almost anything look like progress. A traffic spike feels promising. A few hundred pageviews can suggest that a launch is catching. Sometimes it is. Sometimes your own visits are mixed into the total, half the traffic came from bots, and the rest stayed only long enough to realize they had clicked the wrong link.
The answer is not to ignore your analytics. It is to read them with more skepticism.
When a product is new, the numbers are small, noisy and easy to overinterpret. One enthusiastic visitor can change an average. One popular post can send a rush of people who care about your story but have no need for your product. Ten well-matched visitors may reveal more than 500 accidental ones.
Early traffic is not a verdict. It is evidence.
The useful question is not simply, “How many people visited?” It is: Who came, what did they do, and what can you reasonably learn from it?
Start with where the traffic came from
Before celebrating or panicking over a number, find its source. Twenty visitors from a niche founder community may be more valuable than 300 from a broad social post. The first group may already understand the problem you solve. The second may simply be curious about the announcement.
Every traffic source arrives with context. A visitor from search is looking for an answer. A visitor from a directory is comparing possible tools. Someone arriving from your personal account may be more interested in you than the product. A referral comes with a measure of borrowed trust.
For each meaningful source, look beyond the click. Did people stay long enough to understand the product? Did they open another page, click the main call to action, sign up, try the product or return later?
The source with the most visitors is not always the one producing the strongest signal. A smaller channel that consistently sends interested people may be worth far more than a burst of drive-by attention.
Separate visibility from intent
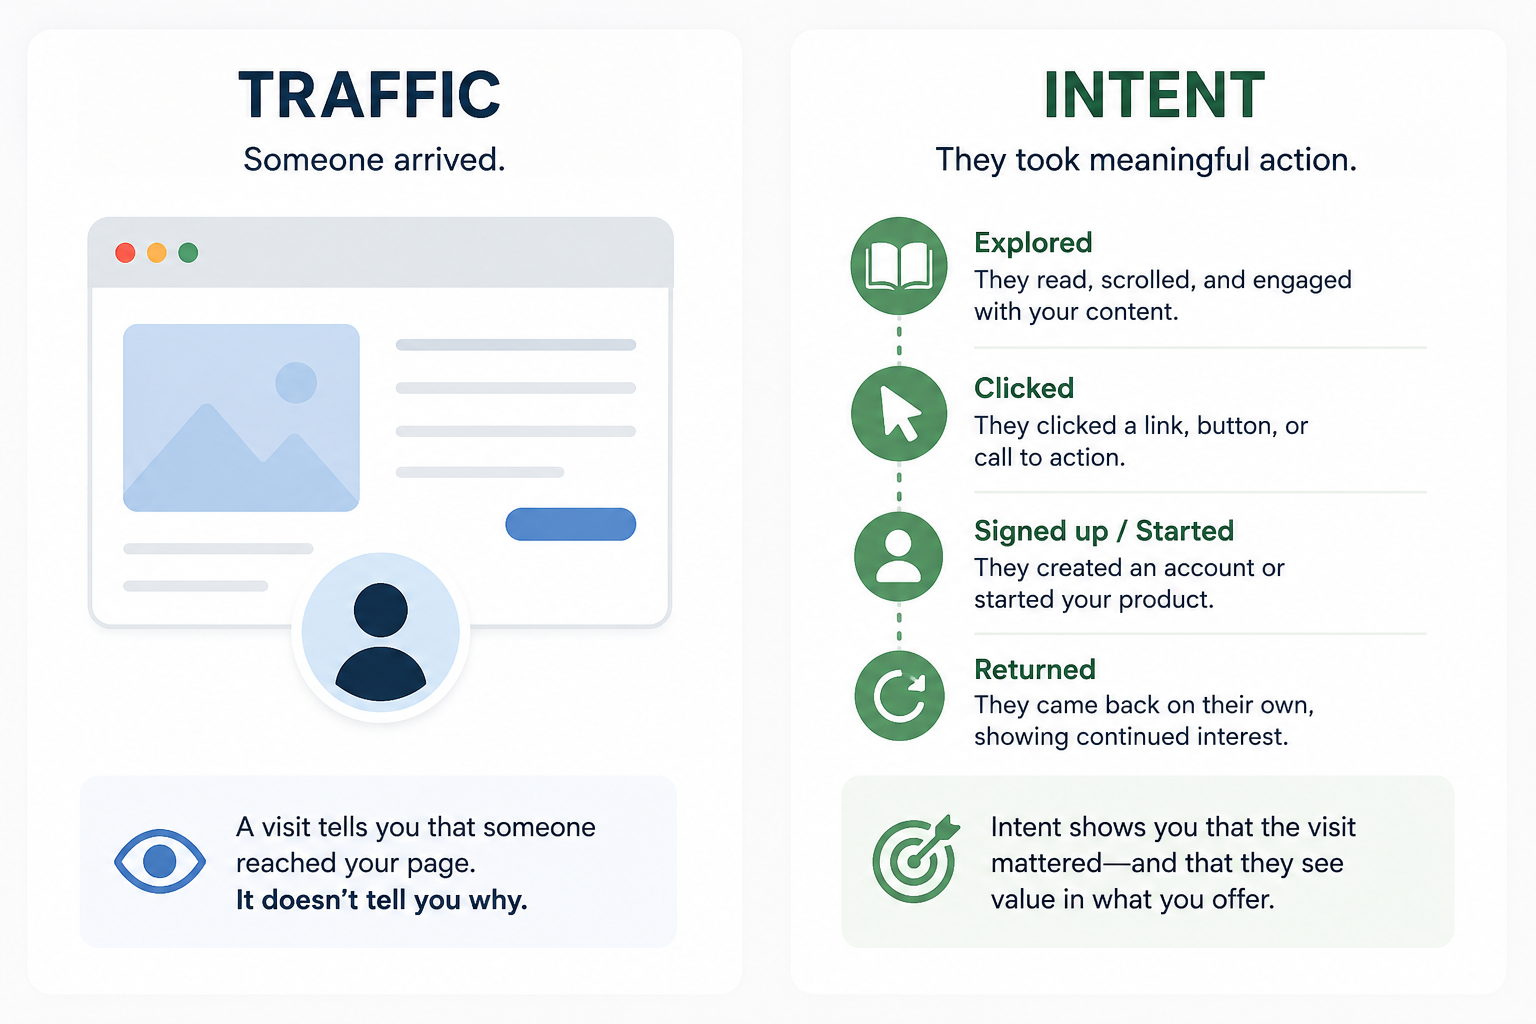
A visit tells you that someone reached the page. It does not tell you why.
The visitor may be a potential customer, another founder studying your landing page, a friend supporting your launch or a competitor taking notes. They may have clicked because the post was interesting even though the product was irrelevant to them.
Raw traffic is best understood as visibility, not demand. It tells you whether people encountered the product. It does not tell you whether they want it.
Intent appears further down the path. Someone who reads the page, checks pricing, opens the demo and returns the next day is giving you a stronger signal than someone who lands, glances and leaves. Neither visit is meaningless. They simply mean different things.
Visibility gives the product a chance to be understood. Behavior tells you what happened with that chance.
Did people stop?
Clicks are easy to count, but they require almost no commitment. People click while distracted, skeptical or bored in line at the grocery store.
The more useful signal appears after the click: Did they stop?
On BuildHop, a tracked view records that someone reached a product. A completed view means the visitor stayed for at least five seconds. Five seconds is not proof of demand, but it does show that the visitor did not reject the product immediately.
If a product receives many views but few completed views, traffic volume may not be the problem. The audience may be poorly matched. The page may load slowly. The headline may be unclear. The design may undermine trust. Visitors may not understand what the product does or why it matters.
A low completion rate will not tell you exactly what is wrong. It will tell you where to look. That is more useful than concluding that you simply need more traffic. Sending more visitors to an unclear page usually produces a larger sample of the same confusion.
Treat dwell time as a clue
Average dwell time can be useful, but it is easy to mistake it for a grade. Longer is not automatically better.
A visitor may spend three minutes on a page because they are deeply interested. They may also spend three minutes because the product is difficult to understand. Someone may leave after 15 seconds because the product is irrelevant, or because they understood the offer immediately and moved into the product.
Dwell time becomes meaningful only when paired with other behavior. High dwell time and strong CTA activity may suggest real interest. High dwell time with no next step may point to hesitation or confusion. Low dwell time with strong conversion may mean the page is doing its job efficiently. Low dwell time and rapid exits may mean visitors are rejecting the product before they understand it.
Do not ask whether your dwell time is “good.” Ask which explanation best fits the rest of the evidence.
Look for movement
The strongest early signals usually involve movement. A visitor opens the pricing page, watches the demo, creates an account, returns, asks a specific question or shares the product with someone else.
Each action requires more effort than a pageview, which makes it more informative.
You do not need an elaborate analytics stack. You need to decide which actions would indicate genuine interest in your product. For a self-serve tool, that might mean creating an account. For an early B2B product, it might mean checking pricing, booking a call or replying to an outreach message. For a waitlist, it might mean signing up and opening the confirmation email.
The right signal depends on what a genuinely interested visitor should naturally do next. Without a clear next action, traffic data remains vague because you have no way to distinguish browsing from progress.
Beware of percentages built on tiny numbers
Early analytics often produce impressive percentages. A 50% conversion rate sounds extraordinary until it means one person converted out of two. A 100% increase in traffic may mean visits rose from six to 12.
Small wins still matter. The problem begins when percentages make the evidence look more certain than it is.
With limited traffic, one person can shift the result dramatically. You do not yet have a stable pattern. You have an observation.
Use early numbers to form questions, not proclamations. Instead of saying, “The new headline increased conversion by 50%,” say, “The first visitors responded better to the new headline. We need more traffic to know whether the pattern holds.”
Instead of declaring a community your best acquisition channel, note that it sent a small number of highly engaged visitors and is worth testing again. The language is less dramatic, but more accurate.
Recognize vanity traffic
Vanity traffic is not necessarily fake. It is traffic that improves the dashboard without helping you understand whether the product is gaining traction.
A viral founder story, giveaway, broad meme or supportive group chat may send plenty of visitors. That attention can still create awareness, backlinks or future recognition. It should not, however, be mistaken for demand.
One way to identify vanity traffic is to compare the promise that earned the click with the promise the product makes. A post about quitting your job or building something in 48 hours may attract people interested in the story. If the landing page sells payroll software, many of those visitors were never potential customers.
The post succeeded. The product was not necessarily validated.
A cleaner distribution test attracts people through the problem the product solves. The audience may be smaller, but the resulting behavior is easier to interpret.
Returning visitors matter
A first visit often reflects curiosity. A return visit suggests that the product stayed in the visitor’s mind.
They may be reconsidering it, checking an update, showing it to a colleague or waiting until the need becomes more urgent. Returning visitors matter especially for products with longer decision cycles. Not everyone is ready to sign up the first time they encounter a tool.
This is also why ongoing discovery matters. A potential user may first see your product in a social post, encounter it again in a directory and return later through search or a recommendation.
Repeated attention is not a conversion, but it can be the bridge to one.
Use feedback to explain the numbers
Analytics can tell you that people left. They cannot always tell you why.
A short comment from a real visitor may be worth more than an hour spent studying a dashboard. Perhaps they thought the product was only for agencies. Perhaps they could not tell whether it was free. Perhaps the demo looked useful, but connecting an account felt risky. Perhaps they liked the product but did not need it yet.
Those explanations point to different problems. Low conversion does not always mean the button needs to be brighter. The audience may be wrong. The offer may be unclear. The product may require too much trust. The need may not feel urgent.
Pair behavioral data with direct feedback whenever possible. Ask what the visitor expected to find, what stopped them from trying the product, who they thought it was for and what felt unclear.
The goal is not to persuade them. It is to find the gap between what you meant to communicate and what they actually understood.
Read the numbers as a sequence
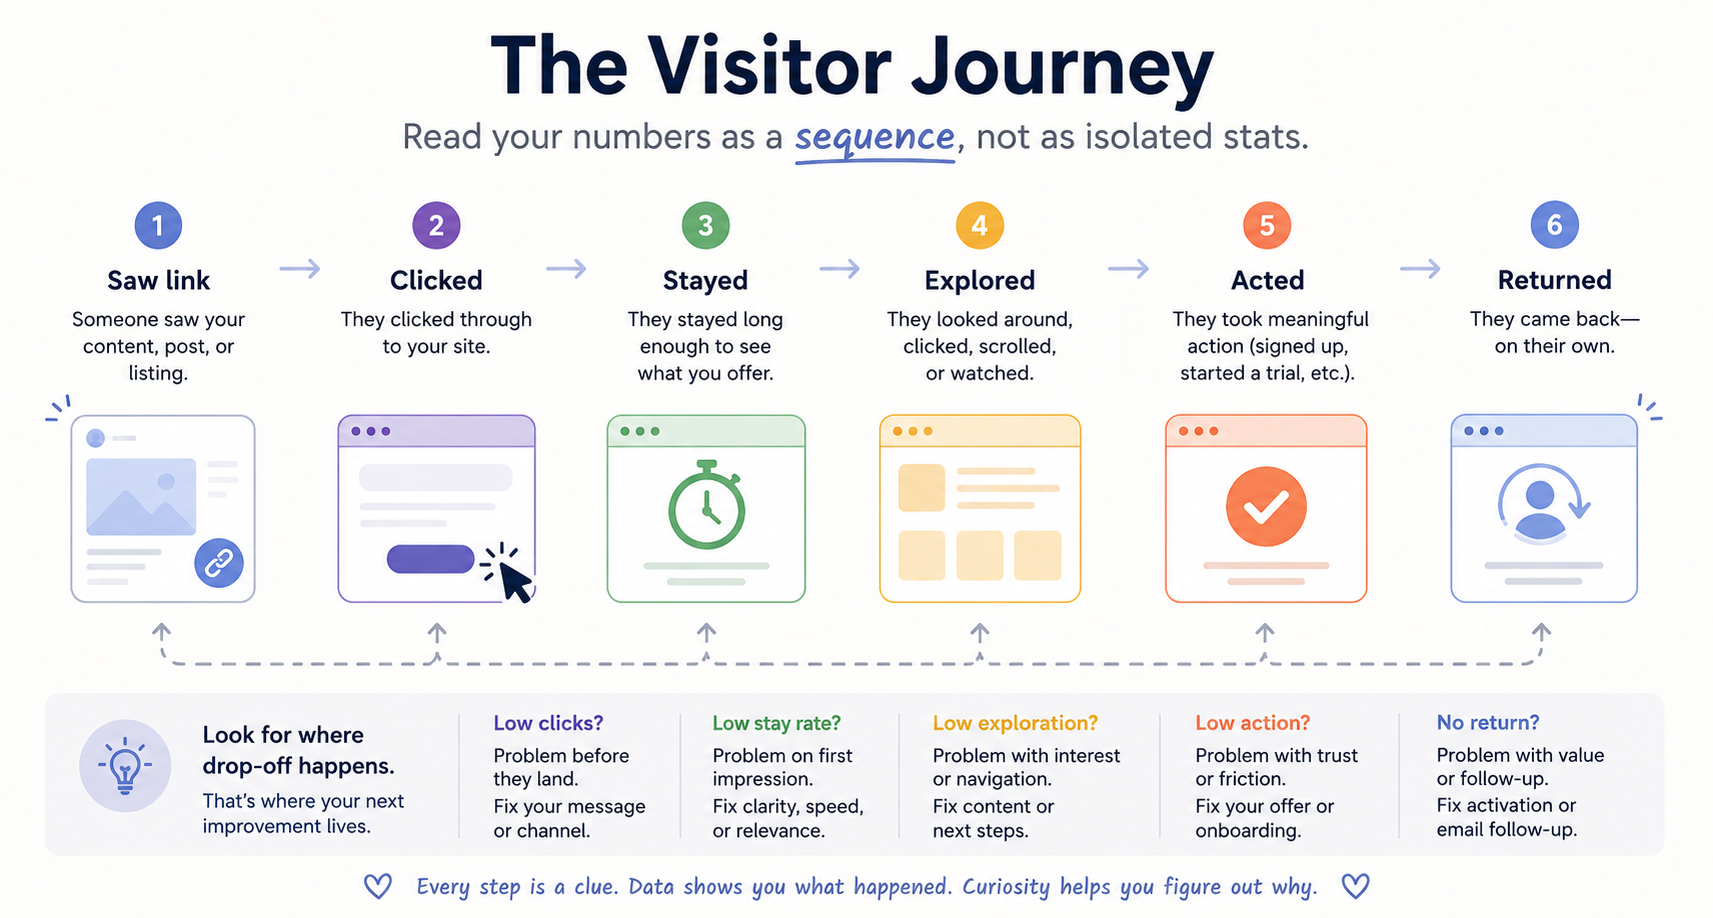
Analytics become more useful when you stop treating every metric as an isolated score.
People encountered the link. Some clicked. Some stayed. Some explored. Some took the next step. Some returned. Some became users.
At each stage, look for where interest weakens. If few people click, the problem may be the channel or the message used before the visit. If people click but leave immediately, inspect the audience match, loading experience and first impression. If they stay but do not continue, look at clarity, trust and the call to action.
If people begin signup but do not finish, investigate onboarding friction. If they sign up but do not return, the problem is no longer traffic. It is activation or product value.
This sequence prevents you from treating every disappointing number as a marketing failure. Sometimes traffic is doing its job perfectly. It is revealing the next weak point.
Compare channels by quality, not volume
Imagine that one channel sends 200 visitors. Most leave quickly, and one signs up. Another sends 25 visitors. Twelve spend meaningful time on the page, four start the product and two return later.
The first channel produced more traffic. The second may be more valuable.
Volume matters, but only in context. Compare channels by how well the audience matches the product, whether visitors stay, whether they take a meaningful next step, whether they return and how difficult the channel is to sustain.
The best early channel is not always the one that creates the largest spike. It is the one that repeatedly brings people who behave like potential users.
Give patterns time to emerge
Early founders often change too much, too quickly. The headline changes Monday. The CTA changes Tuesday. Pricing moves Wednesday. A new audience is targeted Thursday. By Friday, the analytics contain five experiments blended into one tiny dataset.
Speed can be useful. Constant motion can make learning impossible.
When you notice an interesting signal, test it again. Share the same version of the product in another relevant place. Ask several people the same feedback question. Give more visitors a chance to respond to the same page.
You are looking for patterns that survive beyond one post, one visitor or one fortunate afternoon. Early data will always be imperfect. You do not need certainty before making a decision, but you should avoid making a large decision from a small coincidence.
A simple weekly review
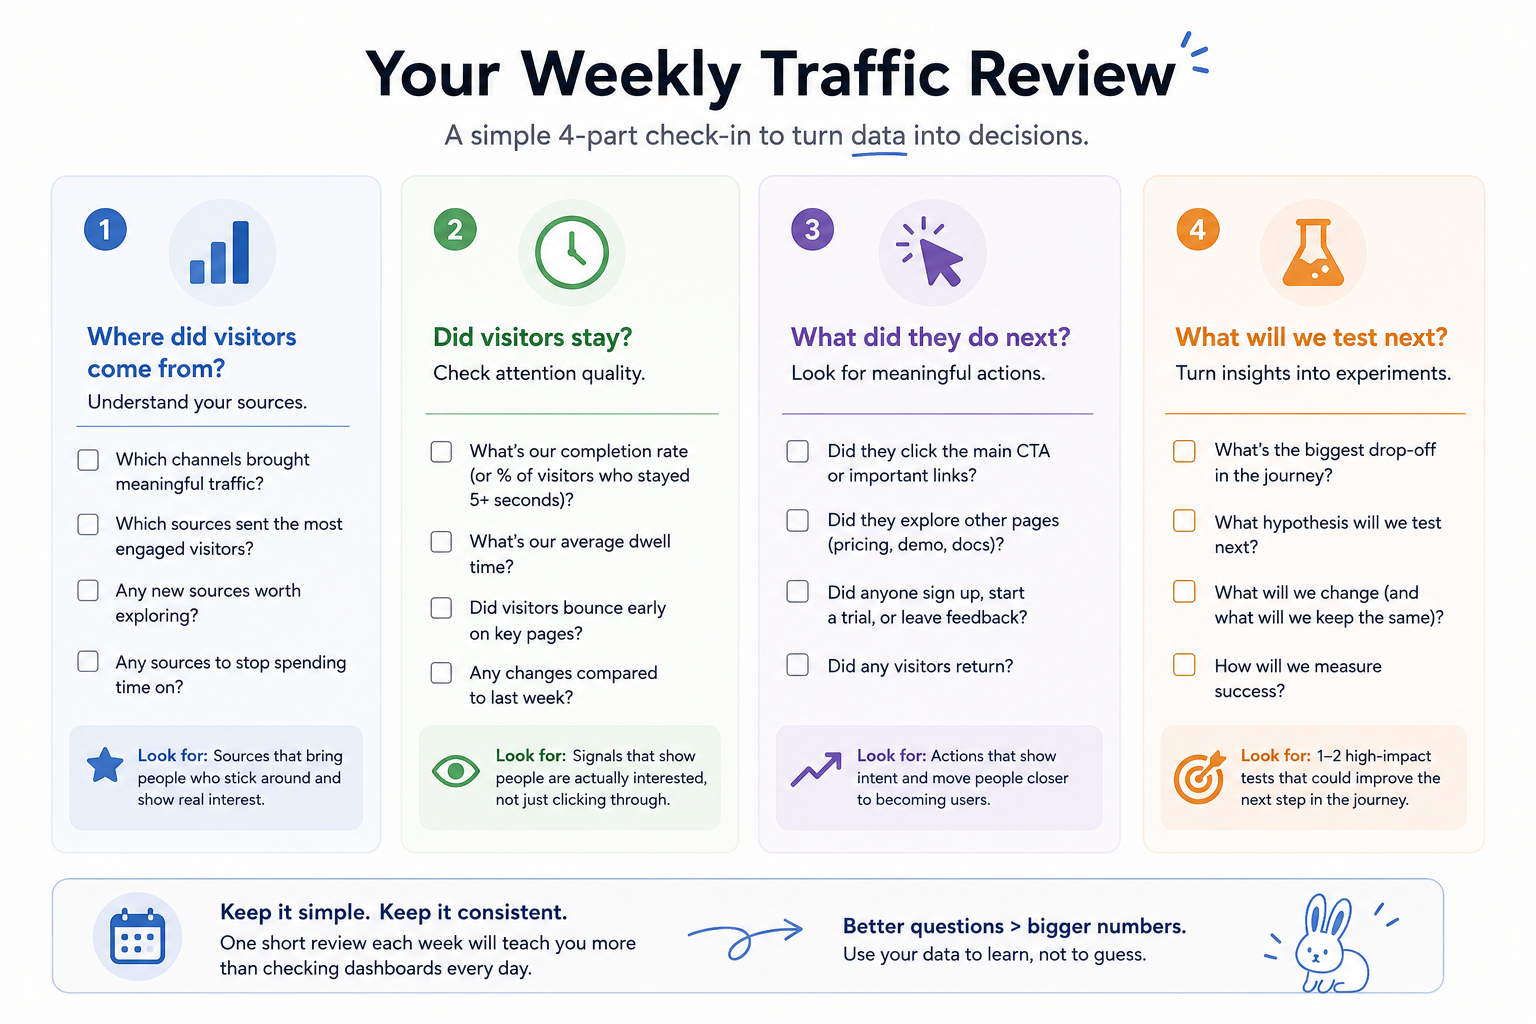
You do not need to monitor analytics every hour. Watching too closely can make ordinary fluctuations feel like emergencies.
A weekly review is often enough. Start with where visitors came from and identify which sources brought meaningful attention rather than only clicks. Then look at whether people stayed and what they did next. Did they explore, click the main CTA, sign up, return or offer useful feedback?
Finally, decide what you learned and what you will test next. You may repeat a promising channel, clarify the headline, improve the demo, ask for more specific feedback or stop investing in a source that produces traffic but little interest.
One review. One or two changes. Another week of evidence.
The number is not the story
Early traffic matters because it tells you whether people are finding the product and gives you a chance to observe what happens when they do. But pageviews alone cannot tell you whether the idea is working.
The story lies in the relationship between the numbers. Where did people come from? Did they stop? Did they understand? Did they move? Did they return? Did they tell you what they needed?
That is the more honest way to read early startup traffic: not as applause or rejection, but as evidence.
BuildHop tracks signals such as views, completed views, dwell time and completion rate because founders need more than a visitor count. They need to know whether people are actually stopping for what they built.
Traffic tells you that the product was seen. Attention tells you whether it may be worth seeing again.
